Getting Started
Web Map Page Layout & Functions
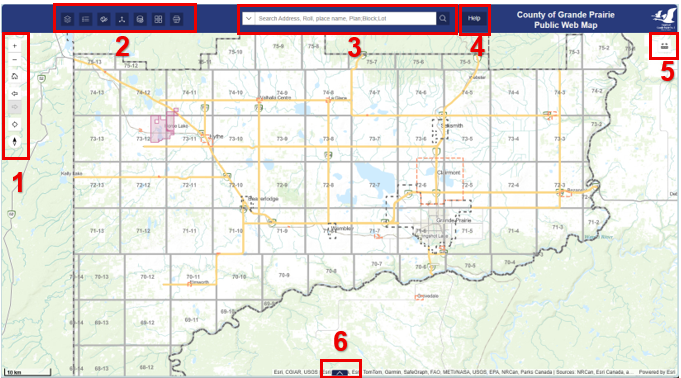
1. Map Navigation Toolbar
The Map Navigation Toolbar is at the top left side of the map.
It contains tools to move around the map.
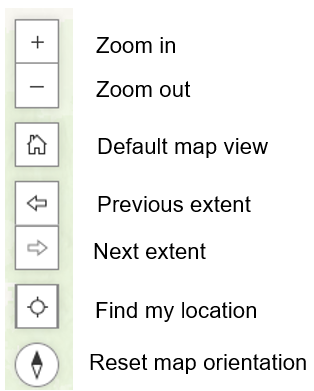
Zoom in – zoom in one preset zoom level
Zoom in – zoom in one preset zoom level
Zoom out – zoom out one preset zoom level
Default map view – zooms to preset default map view
Previous extent – moves map back to previous map extent
Next extent – moves map to the next extent after having moved to previous extent
Find my location – zooms map to your current location (has known limitations depending on device and browser used)
Reset map orientation – returns the map to upright orientation after being rotated
Additional map navigation information
Zoom in with box - Hold the Shift key down, draw a box with left mouse button, then release the mouse button to zoom to the location.
Pan with mouse – Click and hold the left mouse button down and drag the map in the desired direction, then release the mouse button.
Pan with arrow keys - Press the keyboard arrow keys to move the map in the desired direction.
Rotate map – Hold the right mouse button down and move the mouse to rotate the map.
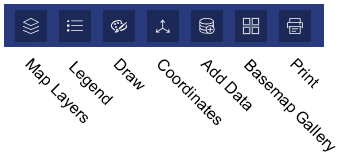
2. Map Toolbar
The Map Toolbar is at the top left corner of the map.
It contains tools to interact with the map.
Be aware that when using many of the tools such as Draw the interactions are temporary and are lost when the map is refreshed or the browser cache is cleared.
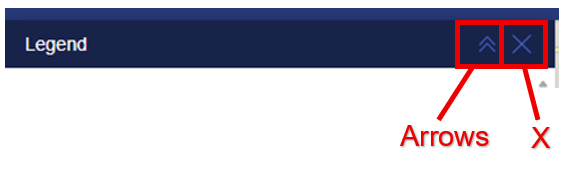
All map tools can be Closed (X) or Expanded / Collapsed (arrows).
A. Map Layers Tool

The Map Layers Tool opens the layer list (Table of Contents) to show the data available in the map.
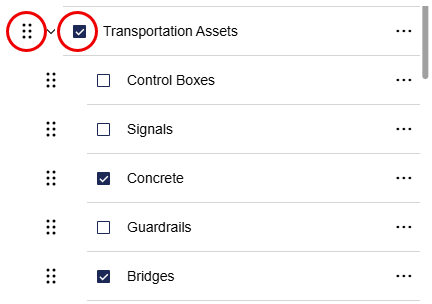
The check box next to the Group Title (e.g.Transportation Assets) OR Layer turns the layers on or off in the map.
6 Dots – click the dots and hold to move data up or down in the layer list (changes the order they draw in the map).
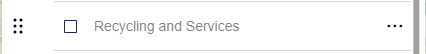
The data layers greyed out are not available at the current scale (e.g. Recycling and Services).
The side arrow (>) next to the check box expands or collapses the individual layers inside the group.
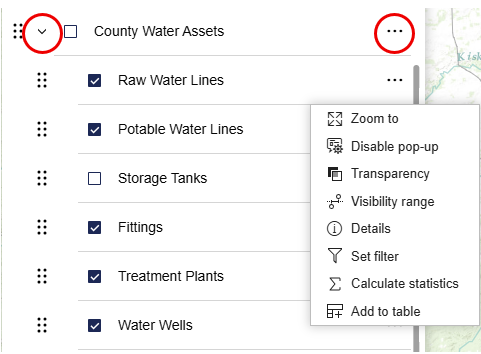
Ellipsis (3 dots) on single layer
- Zoom to – zooms the map to a scale and position the data is visible in the map
- Details – opens metadata in a new window
- Set filter – determine data shown using data attributes
- Calculate Statistics - calculates statistics such as Sum, Minimum, Maximum, Average for the selected layer
- Add to table – adds the data attributes to the attribute table
B. Legend Tool

The Legend Tool opens the Legend to show data symbology.
The symbology shown is for the currently visible layers in the map.
C. Draw Tool

The Draw Tool allows the user to draw shapes and area measurements on the map.
Refer to the Detailed Help Topic - Draw Tool for more information.
D. Coordinates Tool

The Coordinates Tool displays the coordinates in two modes.
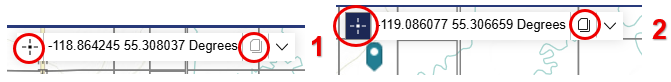
Click the button on the Coordinate Tool to toggle between the modes.
1. The tool displays the mouse location coordinates as it moves around the map.
2. Click the map to drop a pin and the fixed coordinates will display.
Click the Copy button to copy the coordinates to the clipboard which can be pasted in a document.
E. Add Data Tool

The Add Data Tool allows the user to add additional data to the map.
The supported formats are:
- Web Service, CSV, KML, GeoJSON, and GPX.
Refer to the Detailed Help Topic - Add Data Tool for more information.
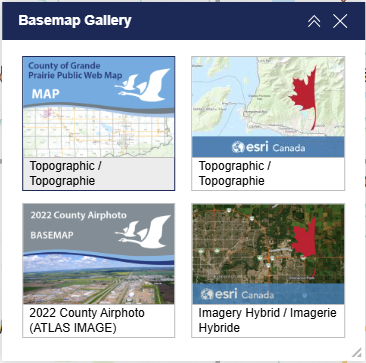
F. Basemap Gallery Tool

The Basemap Gallery Tool allows the user to choose between available basemaps.
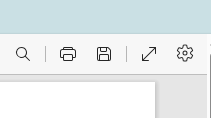
G. Print Tool

The Print Tool creates a pdf (or a png image) that can be printed or saved as needed.
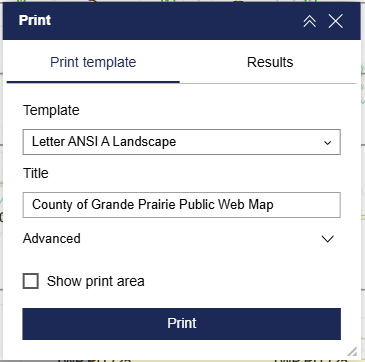
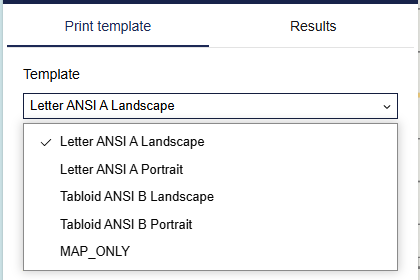
Choose between the available template sizes.
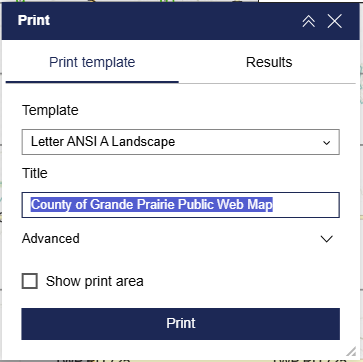
The user is able to enter any text in the Title field (this will appear on the map). Use the opportunity to choose a meaningful title.
The Advanced dropdown menu has various options.
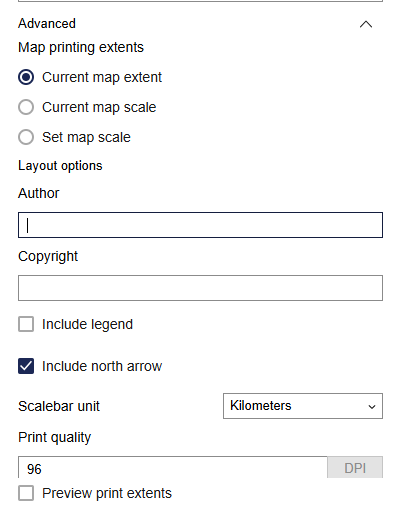
Map printing extents
- Current map extent
The print will try to keep the current map extent on the screen. Be aware if using an extra large monitor as the print behaviour is not predictable.
- Current map scale
The scale will print at the current map zoom level.
- Set map scale
The user is able to enter a specific scale for the print. The print will show the map based on the designated scale.
The user is able to enter any text in the Author and Copyright fields.
The Scalebar unit can be changed.
The files appear on the Results tab to view, print, and save.
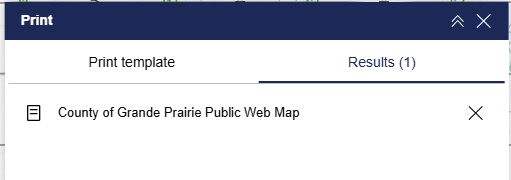
Print or save using your Internet browser.
3. Search Bar

The Search bar is at the top centre of the map.
It allows the user to search for data features in the map.
The user can search using various search terms such as:
- Roll number
- Physical address – rural or civic
- LINC number
- ATS reference
- LSD reference
- Plan Block Lot
- Subdivision name
- Point of Interest
Type the desired search term in the search bar and press enter. The map will zoom to the location. If there are multiple matches for the search a drop down will appear to let you choose the correct option.
When searching for a parcel using the Roll Number, LINC number, Lease Number, or Plan Block Lot the map will zoom to the parcel and open the information pop-up for that parcel.
If the map does not zoom right away, try again. Or click on the search result.
Refer to the Detailed Help Topic - Search Bar for examples and more detailed information.
4. Help Button

The Help documents are shown when clicked.
5. Measure Tool

The Measure Tool is at the top right corner of the map.
It allows the user to measure a distance or area.
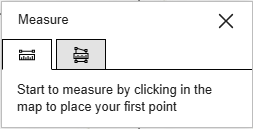
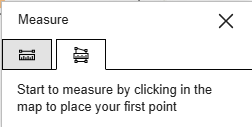
Measure along a line (distance). Measure an area.
Start measuring by left clicking a location in the map. Double-click to complete the measurement.
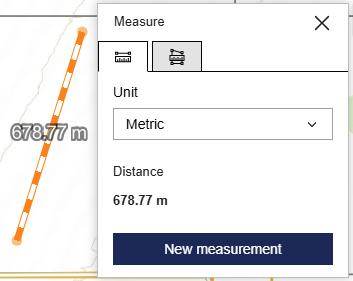
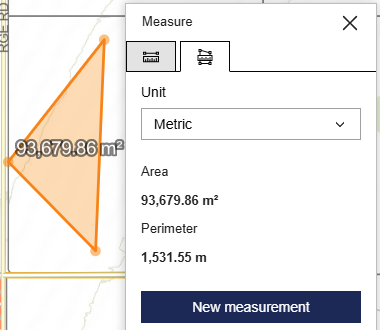
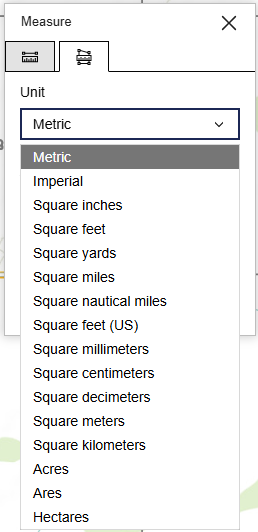
The Unit defaults to Metric. This can be changed in the dropdown list.
6. Attribute Table Tab
The Attribute Table Tab is at the bottom centre of the map.
The attribute table is minimized by default.
Click the tab to show attribute table after adding attributes for specific data.
The data attributes must be added to the table to be viewed.
Refer to the Detailed Help Topic - Attribute Table Tab for more information.